Graphs
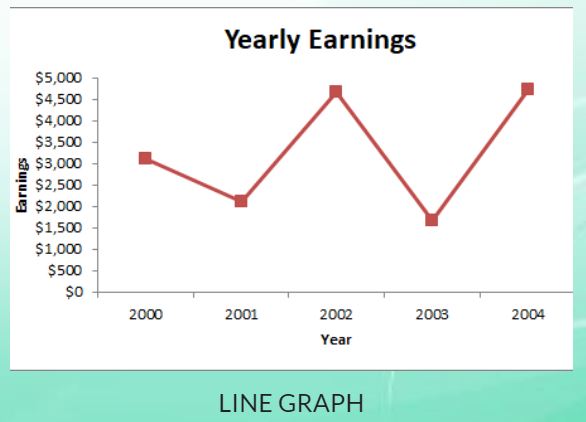
Graphs focus on raw data and show trends over time.
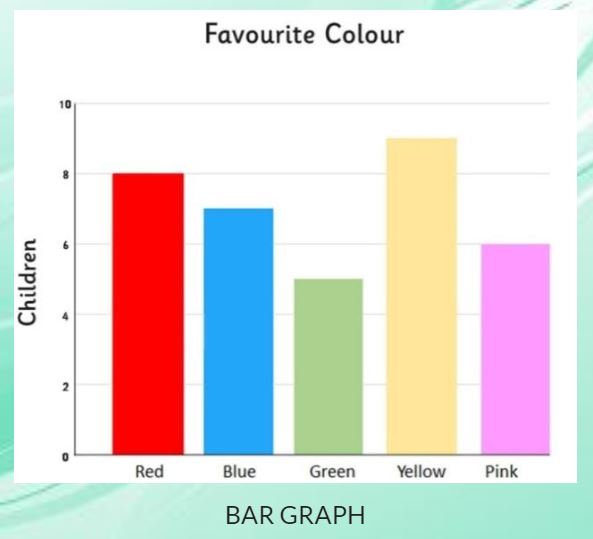
Bar graphs offer a simple way to compare numeric values of any kind, including inventories, group sized and financial predictions.
A pictograph uses pictures or symbols to display data instead of bars. Each picture represents a certain number of items.
Someone might use a scatter plot graph to show the relationship between a person’s height and weight, for example.
Area graphs show a change in one or more quantities over a certain period of time. They often help when displaying trends and patterns.
Charts
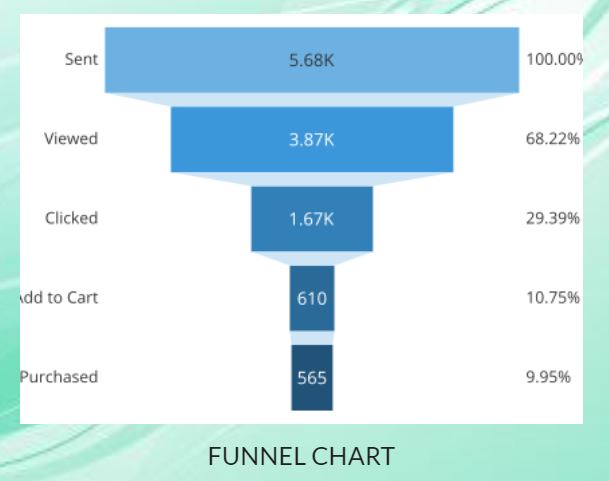
Charts are tables, diagrams or pictures that organize large amounts of data in a clear and concise way. People use charts to interpret current data and make predictions.
Flowcharts help organize the steps, decisions or actions in a process from beginning to end.
A pie chart presents the different parts of a whole.
You could use a waterfall chart to highlight the budget versus the amount spent. It demonstrates both the positive and negative impact.
Diagrams
Students can use diagrams to structure writing projects, make decisions, solve problems, study, brainstorm or plan a project.
Venn diagram is used for comparing and contrasting two concepts.
 |
| WEB DIAGRAM |
Web diagrams are created using boxes or bubbles. In this type of diagram, one central idea is written inside a center box or bubble. Stems are drawn outward from this center box with new boxes/bubbles attached. The new boxes/bubbles house ideas that are related to the central idea. It grows like that of a web depending on the given information.
 |
| FLOW DIAGRAM |
Drawings and maps are models that represent something in a form of labels to explain what is being shown.
Reference
Pancare, Rachel. "Types of Diagrams." Classroom, https://classroom.synonym.com/use-charts-diagrams-classrooms-5836308.html


No comments:
Post a Comment